
Your Model Works in a Notebook. Now What? A Friendly Intro to NVIDIA Triton Inference Server


You trained a model. It gives good results in your notebook. Now someone asks the scary question: "Can we put this in production?"
The first thing most of us do is wrap it in Flask or FastAPI. Load the model, add a /predict endpoint, ship a Docker image. It works. Until traffic grows, the GPU sits at 15% while requests pile up, and a second team shows up with a TensorFlow model while yours is PyTorch.
That's the gap NVIDIA Triton Inference Server fills. I've spent the last few years running Triton in production for models serving a very large user base, and in this post I want to give you the intro I wish I had on day one: what Triton is, the few ideas you actually need, a working example you can run on your laptop, and how to take it to Google Cloud.
What is Triton, in one paragraph
Triton is an open-source inference server from NVIDIA. You give it a folder of models, and it serves them over HTTP and gRPC with a standard API. It supports many frameworks through "backends": TensorRT, PyTorch, ONNX Runtime, OpenVINO, Python, and RAPIDS FIL for tree models like XGBoost. It runs on GPUs and CPUs, and it gives you production features out of the box: batching, running multiple copies of a model, model versioning, and Prometheus metrics.
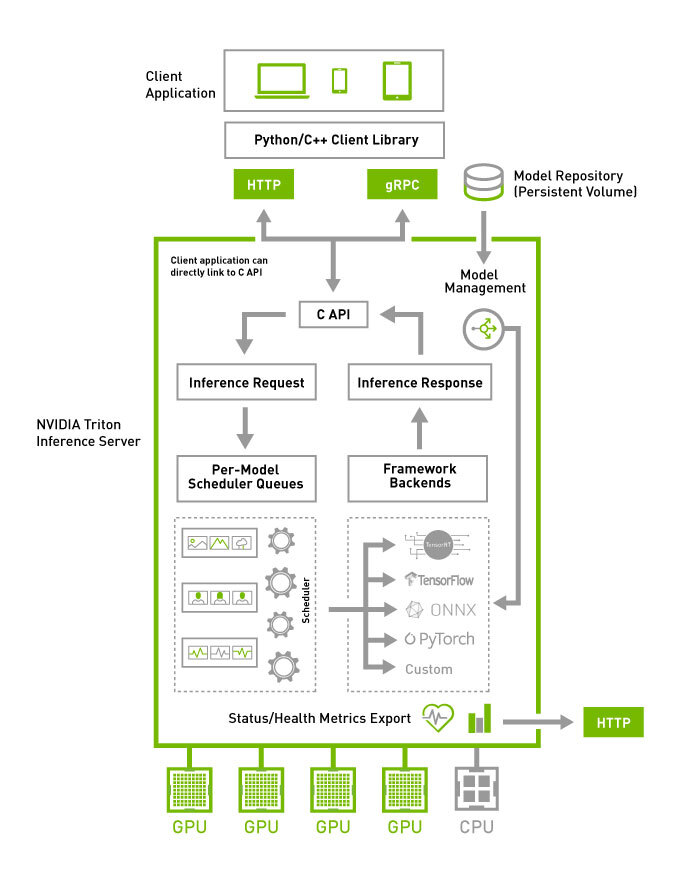 Triton's high-level architecture: requests come in over HTTP/gRPC, go through per-model scheduler queues, and run on framework backends across GPUs and CPUs. Source: NVIDIA Triton documentation
Quick naming note: NVIDIA now calls it Dynamo-Triton (formerly Triton Inference Server), and it sits next to NVIDIA Dynamo, which focuses on large-scale LLM serving. The code, the containers, and the docs you'll find online still mostly say "Triton", so that's what I'll use here.
Why not just FastAPI?
FastAPI is great. For a small model with low traffic, it may be all you need. But once things get serious, you start rebuilding the same features by hand:
- Batching. GPUs are fast when they process many inputs at once. Single requests one by one waste most of the hardware. Writing a correct request-batching queue yourself is harder than it looks.
- Concurrency. Running two or three copies of a model on the same GPU to keep it busy.
- Many frameworks. One server for PyTorch, ONNX, TensorRT, and XGBoost models instead of one custom service per team.
- Observability. Latency, queue time, and GPU usage per model, ready for Prometheus.
- Model lifecycle. Versions, loading and unloading models without rebuilding images.
Triton gives you all of this with a config file. That's the main pitch.
The four ideas you need
Triton has a lot of features, but as a beginner you only need four concepts.
1. The model repository
Triton reads models from a folder with a fixed layout. Each model gets its own directory, a config file, and numbered version folders:
model_repository/
└── resnet18/
    ├── config.pbtxt
    └── 1/
        └── model.onnx

The 1/ is the model version. Put a 2/ next to it later, and Triton can serve the new version. The repository can live on local disk, or on cloud storage like Google Cloud Storage (gs://...), which is very handy on GCP.
2. The backend
The backend is the engine that runs your model: onnxruntime, pytorch, tensorrt, python, fil, and others. You pick it in the config. The Python backend deserves a special mention: it lets you write any custom logic (pre-processing, post-processing, glue code) in plain Python and serve it like a model.
3. config.pbtxt
This small text file tells Triton how to run the model: which backend, what the inputs and outputs look like, the max batch size, and performance settings. This is where most of your tuning happens.
4. Dynamic batching and instance groups
These two settings are where Triton earns its keep:
- Dynamic batching tells Triton to wait a tiny bit (think microseconds) and group incoming requests into one batch before sending them to the model. Clients still send one request each; Triton does the grouping.
- Instance groups tell Triton how many copies of the model to run, and where (GPU or CPU). Two instances on one GPU means one can compute while the other is moving data.
 Dynamic batching turns many small requests into one efficient run.
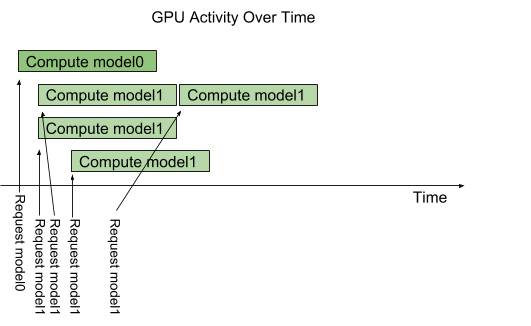 With three instances of model1, three requests run in parallel and the fourth waits for a free instance. Source: NVIDIA Triton docs — Concurrent Model Execution
There's more (ensembles, the model analyzer, sequence batching for stateful models), but you can go a long way with just these four.
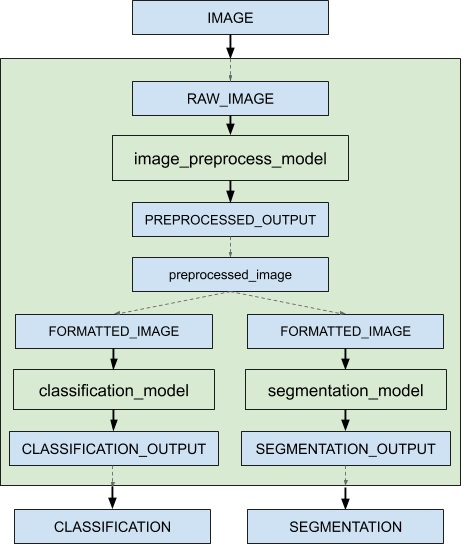 A peek at what comes later: an ensemble chains pre-processing, models, and post-processing into one pipeline. Source: NVIDIA Triton docs — Ensemble Models
Hands-on: serve a model in 10 minutes
Let's serve a ResNet-18 image classifier. You need Docker. A GPU is nice but not required; I'll show the CPU version.
Step 1: Export the model to ONNX
# export.py
import torch
import torchvision

model = torchvision.models.resnet18(weights="DEFAULT").eval()
dummy = torch.randn(1, 3, 224, 224)

torch.onnx.export(
    model,
    dummy,
    "model_repository/resnet18/1/model.onnx",
    input_names=["input"],
    output_names=["output"],
    dynamic_axes={"input": {0: "batch"}, "output": {0: "batch"}},
)
mkdir -p model_repository/resnet18/1
pip install torch torchvision onnx
python export.py
The dynamic_axes part is important: it makes the batch dimension flexible, so Triton can batch requests together.
Step 2: Write the config
# model_repository/resnet18/config.pbtxt
name: "resnet18"
backend: "onnxruntime"
max_batch_size: 16

input [
  {
    name: "input"
    data_type: TYPE_FP32
    dims: [ 3, 224, 224 ]
  }
]
output [
  {
    name: "output"
    data_type: TYPE_FP32
    dims: [ 1000 ]
  }
]

dynamic_batching {
  max_queue_delay_microseconds: 100
}

instance_group [
  {
    count: 2
    kind: KIND_CPU
  }
]
Notice that dims doesn't include the batch dimension. When max_batch_size is above zero, Triton adds it for you. This trips up almost everyone the first time.
On a GPU machine, change KIND_CPU to KIND_GPU.
Step 3: Start Triton
docker run --rm \
  -p 8000:8000 -p 8001:8001 -p 8002:8002 \
  -v $(pwd)/model_repository:/models \
  nvcr.io/nvidia/tritonserver:<xx.yy>-py3 \
  tritonserver --model-repository=/models
Replace <xx.yy> with a release tag from the NGC catalog (they follow a year.month pattern, like 26.07). On a GPU machine, add --gpus all.
The three ports are HTTP (8000), gRPC (8001), and Prometheus metrics (8002). When you see your model listed as READY in the logs, check health:
curl -v localhost:8000/v2/health/ready
A 200 OK means you're live.
Step 4: Send a request
pip install "tritonclient[http]" numpy
# client.py
import numpy as np
import tritonclient.http as httpclient

client = httpclient.InferenceServerClient(url="localhost:8000")

image = np.random.rand(1, 3, 224, 224).astype(np.float32)

inp = httpclient.InferInput("input", image.shape, "FP32")
inp.set_data_from_numpy(image)
out = httpclient.InferRequestedOutput("output")

result = client.infer("resnet18", inputs=[inp], outputs=[out])
print("Predicted class:", result.as_numpy("output").argmax())
That's it. You're serving a model with batching, two parallel instances, and metrics, without writing a single line of server code.
Step 5: Measure it
Triton ships a load-testing tool called perf_analyzer in its SDK container:
docker run --rm --net=host \
  nvcr.io/nvidia/tritonserver:<xx.yy>-py3-sdk \
  perf_analyzer -m resnet18 --concurrency-range 1:8
It shows throughput and latency as concurrency grows. Try it once with dynamic_batching and once without it. Seeing the difference with your own eyes is the best way to understand why batching matters.
Also open localhost:8002/metrics. You'll see request counts, queue time, and compute time per model. Queue time is the number to watch: if it keeps climbing, your model can't keep up.
Taking it to Google Cloud
On Google Cloud you have two main paths.
Option A: GKE
This is what I'd pick if you already run Kubernetes or have many models. Two things make it smooth:

Put the model repository in GCS. Triton reads
gs://paths directly, so you don't need to bake models into the image. Upload the folder:gsutil cp -r model_repository gs://YOUR_BUCKET/model_repositoryGive the pod read access with Workload Identity instead of key files.
Use Triton's health endpoints for probes. Kubernetes should only send traffic when the model is loaded.
A minimal Deployment looks like this:
apiVersion: apps/v1
kind: Deployment
metadata:
  name: triton
spec:
  replicas: 1
  selector:
    matchLabels:
      app: triton
  template:
    metadata:
      labels:
        app: triton
    spec:
      serviceAccountName: triton-sa   # bound to a GCP SA via Workload Identity
      containers:
        - name: triton
          image: nvcr.io/nvidia/tritonserver:<xx.yy>-py3
          args:
            - tritonserver
            - --model-repository=gs://YOUR_BUCKET/model_repository
          ports:
            - containerPort: 8000
            - containerPort: 8001
            - containerPort: 8002
          readinessProbe:
            httpGet:
              path: /v2/health/ready
              port: 8000
          livenessProbe:
            httpGet:
              path: /v2/health/live
              port: 8000
          resources:
            limits:
              nvidia.com/gpu: 1
Add a Service in front, scrape port 8002 with Managed Service for Prometheus, and you have a solid starting point.
Option B: Vertex AI
If you don't want to manage a cluster, Vertex AI supports Triton as a custom serving container, with the model repository in GCS. Google has an official guide and sample notebooks for this (links in the comments / at the end). It's the fastest way to get a managed endpoint, with less control over tuning than GKE.
Beginner mistakes I've seen (and made)
A few lessons from running Triton in production:
- Pin your versions. The Triton container, its backends, and tools like the model analyzer are tied to specific library versions. I've seen a model fail to load because a startup script ran
pip installand quietly upgraded packages past what the image expected. Build your image once, with fixed versions, and don't install things at container start. - Watch CPU limits on Kubernetes. For CPU models, a tight CPU limit on the pod can cause throttling that looks like "Triton is slow". Check the container's throttling metrics before you blame the model.
- More instances isn't always faster. Adding instances helps until you hit a real limit: GPU memory, CPU cores, or memory bandwidth. Measure with
perf_analyzer, change one thing at a time. - Start simple, then tune. Get a model serving with default settings first. Then add dynamic batching. Then tune instances. Then consider TensorRT. Don't do all four at once.
When Triton is not the right tool
To be fair:
- Serving LLMs? Look at vLLM, SGLang, or NVIDIA Dynamo first. They have LLM-specific tricks like paged KV cache and continuous batching. Triton can serve LLMs through the TensorRT-LLM and vLLM backends, but for most teams a dedicated LLM server is simpler.
- One tiny model, low traffic? FastAPI is fine. Don't add complexity you don't need.
Where Triton really shines: many "classic" models (vision, ranking, recommendation, tree models) from different frameworks, with real traffic, where GPU efficiency and one standard API matter.
Wrapping up
Triton can look intimidating because the docs cover so much. But the core is small: a model repository, a backend, a config file, and two performance knobs. Get the example above running, play with batching and instances, look at the metrics, and you'll understand 80% of what you need for your first production deployment.
In a follow-up post, I'll go deeper into performance tuning: what happens when your model is slow and you need to find out why.
If you try this and get stuck, reach out. Happy to help.
references:
- Triton GitHub: https://github.com/triton-inference-server/server
- Dynamo-Triton overview: https://developer.nvidia.com/dynamo-triton
- Triton on Vertex AI (Google Cloud docs): https://docs.cloud.google.com/vertex-ai/docs/predictions/using-nvidia-triton
- Vertex AI Triton sample notebook: https://github.com/GoogleCloudPlatform/vertex-ai-samples/blob/main/notebooks/official/prediction/get_started_with_nvidia_triton_serving.ipynb
- NGC container catalog: https://catalog.ngc.nvidia.com/orgs/nvidia/containers/tritonserver
Tags: Triton Inference Server, MLOps, Google Cloud, Kubernetes, Machine Learning